As an Amazon seller running Atlatl & Co, I needed better visibility into my business metrics. I found myself constantly refreshing the Amazon Seller app like a slot machine, hoping to see new sales. To solve this problem, I built a dedicated LED display for sales data that sits on my kitchen counter.
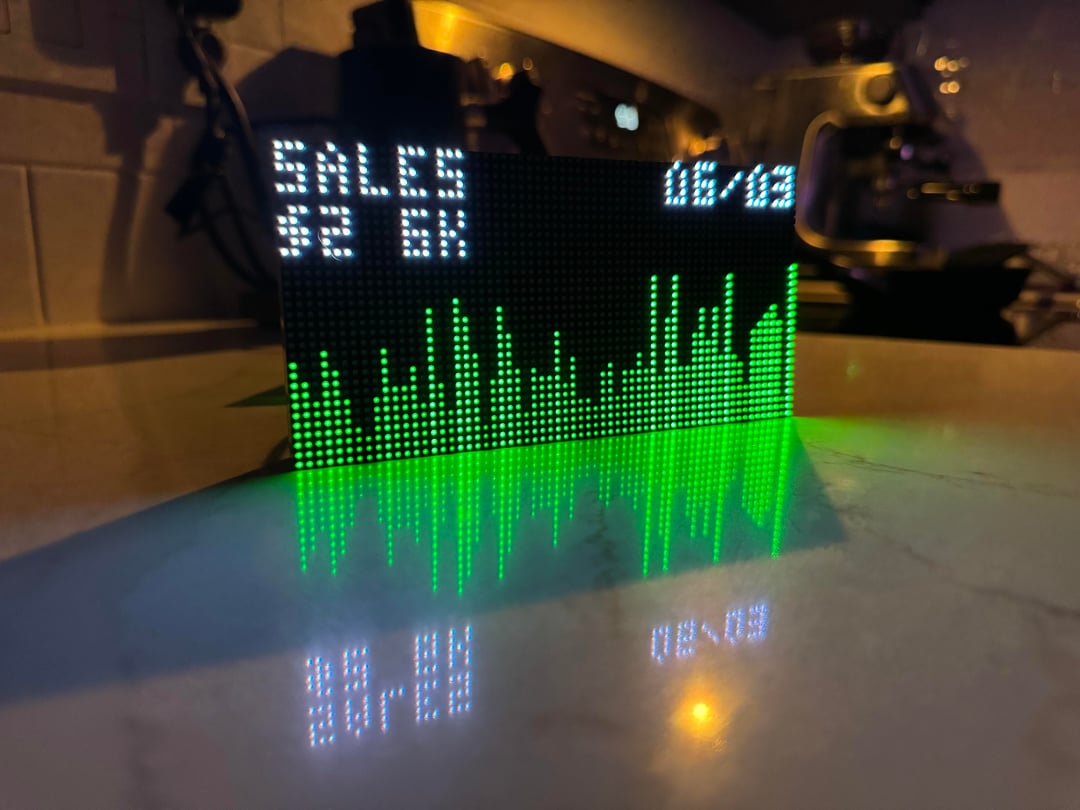
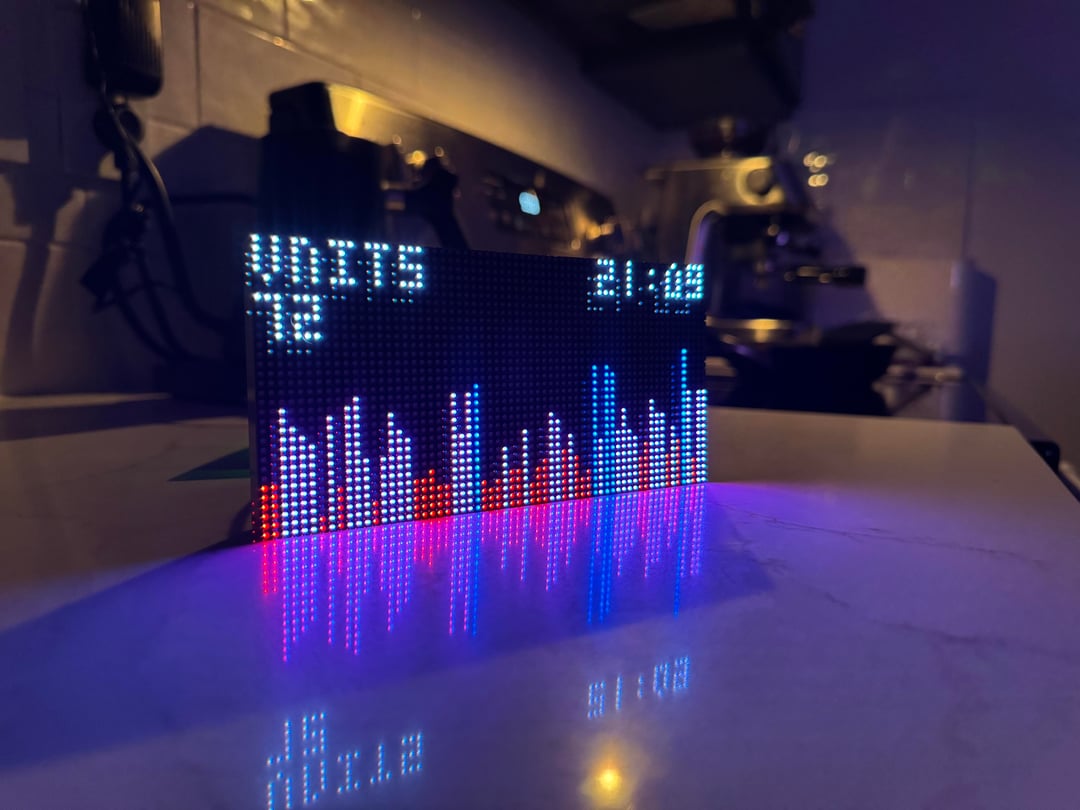
Physical LED dashboard showing sales data (green) and units sold (blue/purple)
The Challenge
Amazon's Seller Central provides data, but it's spread across multiple pages and requires constant checking. The mobile app isn't much better - I found myself obsessively pulling down to refresh throughout the day. I wanted a passive display that would always show my current sales status without requiring any interaction.
Solution: LED Dashboard
Hardware Display
I built a dedicated LED matrix display that shows:
- 64-day Sales History: Bar chart showing the last 64 days of sales data
- Two Rotating Views:
- Dollar sales (in green) with current date
- Units sold (in blue/purple) with current time
- Real-time Updates: Refreshes every five minutes
Technical Implementation
- Data Source: Amazon SP-API with OAuth authentication
- Update Frequency: Polls for new data every five minutes
- Visualization: LED matrix display with custom graphics rendering
- Historical Data: Stores and displays the past 64 days of sales performance
- Display Modes: Toggles between revenue and unit count visualizations
Results & Impact
This physical dashboard has completely changed how I monitor my Amazon business. I almost never check the Seller app anymore, except for review and inventory data. Having the sales data visible at a glance in my kitchen has reduced the anxiety of constant app checking while keeping me informed of my business performance.
After sharing this project on Reddit, I've received numerous requests from other sellers interested in having similar dashboards.
Next Steps
I'm currently working on adding more metrics to the display, including:
- Inventory levels with reorder alerts
- Customer review notifications
- Profitability metrics (after Amazon fees)
- PPC advertising performance
This project is still in active development. I'm considering whether to productize this for other Amazon sellers based on the interest I've received.
← Back to About